

Đề bài IELTS Writing Task 1 dạng Table: The graph below shows the information about medical care in three European countries between 1980 and 2000. Summarize the information by selecting and reporting the main features, and make comparisons where relevant.
Bài mẫu IELTS Writing Task 1 dạng Table nhiều thông tin
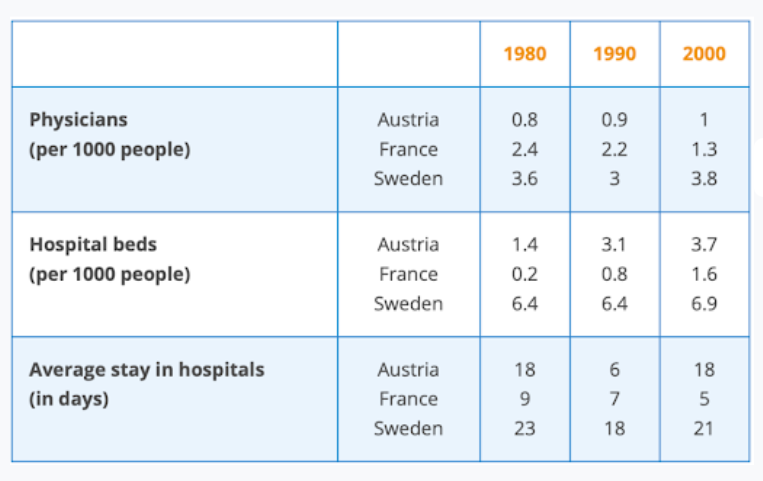
The table compares the number of physicians and hospital beds per 1,000 people, as well as the average length of hospital stays, in Austria, France and Sweden in 1980, 1990 and 2000.
Overall, Sweden consistently had the highest provision of both physicians and hospital beds, whereas France recorded the lowest figures for beds throughout the period. Hospital stays became shorter in France and Sweden, while Austria experienced a marked fluctuation.
In terms of medical personnel, Austria saw a gradual increase in the number of physicians, from 0.8 per 1,000 inhabitants in 1980 to 1 in 2000. By contrast, France experienced a steady decline, falling from 2.4 to 1.3, while Sweden remained relatively stable, with the figure edging up from 3.6 to 3.8 after dipping to 3 in 1990.
A similar upward trend can be seen in the provision of hospital beds in Austria and France. Austria more than doubled its figure, from 1.4 to 3.7 beds per 1,000 people, while France recorded an eightfold increase from 0.2 to 1.6. Sweden, despite having by far the highest provision, remained unchanged at 6.4 beds between 1980 and 1990 before rising slightly to 6.9 in 2000.
Regarding average hospital stays, Austria underwent the most dramatic change, plunging from 18 days to just 6 before returning to 18 days. France recorded a continuous decline, from 9 to 5 days, whereas Sweden fell from 23 to 18 days and then edged up to 21 days.
>> Bài Mẫu IELTS Writing Task 1 Dạng Mixed Charts (2 Biểu Đồ)
Các cụm từ diễn tả số liệu trong Task 1 dạng Table
Các cụm từ diễn đạt tăng giảm, biến động, duy trì, cao/thấp nhất:
- Recorded the highest/lowest figure for: Ghi nhận con số cao/thấp nhất với
- Experienced a marked fluctuation: Trải qua sự biến động đáng kể
- Underwent the most dramatic change: Trải qua sự thay đổi đáng kể nhất
- More than doubled its figure: Tăng hơn gấp đôi số lượng
- Saw a gradual increase in the number of: Chứng kiến sự tăng dần về số lượng của
- Experienced a steady decline: Trải qua sự sụt giảm đều đặn
- Recorded a continuous decline: Ghi nhận sự sụt giảm liên tục
- Remained relatively stable: Duy trì tương đối ổn định
Các cụm từ diễn tả sự biến động kèm số liệu cụ thể:
- Edged up from (3.6) to (3.8) after dipping to (3): Tăng từ 3.6 lên 3.8 sau khi giảm xuống 3 (3.6 -> 3 -> 3.8)
- Recorded an eightfold increase from (0.2) to (1.6): Ghi nhận sự tăng trưởng gấp 8 lần từ 0.2 lên 1.6
- Remained unchanged at (6.4) before rising slightly to (6.9): Duy trì ở 6.4 trước khi tăng nhẹ lên 6.9 (6.4 -> 6.4 -> 6.9)
- Plunged from (18) to just (6) before returning to (18): Giảm mạnh từ 18 xuống chỉ 6 trước khi trở về 18 (18 -> 6 -> 18)
- Fell from (23) to (18) and then edged up to (21): Giảm từ 23 xuống 18 và sau đó tăng lên 21 (23 -> 18 -> 21)
Trên đây là bài mẫu IELTS Writing Task 1 dạng Table với nhiều thông tin, nhiều nhóm số liệu biến động thất thường, không theo xu hướng chung, được đánh giá ở level khó. Nếu bạn đang muốn ôn luyện IELTS Writing nói riêng và 4 kỹ năng nói chung, muốn có lộ trình học tối ưu hiệu quả thì đừng ngại nhắn tin cho kênh Tự Tin Vào Đời nhé!
—
 Page Tự Tin Vào Đời: Các bài viết mới về kinh nghiệm học tập, ứng tuyển, làm việc để sinh viên tự tin bước vào đời.
Tiktok Tự Tin Vào Đời: Các chia sẻ và hỏi đáp nhanh dưới dạng video ngắn
Youtube Hoàng Khôi Phạm: Các video chia sẻ và hỏi đáp nhanh theo nhiều chủ đề hữu ích
